Introduction to Trading View and Its Key Features
In the fast-paced world of financial markets, having access to real-time data, sophisticated analysis tools, and an active trading community can significantly elevate a trader’s or investor’s capabilities. One platform that has gained immense popularity in this arena is trading view. Recognized for its robust charting tools, social integration, and extensive market coverage, Trading View offers both novice and seasoned traders a comprehensive environment for market analysis and decision-making. This article explores the platform’s core features, practical uses, and advanced techniques to help you maximize its potential for successful trading.
Understanding the Trading View Platform
Trading View is more than just a charting software; it’s a social trading network designed to foster collaboration, share insights, and analyze a vast array of financial assets. Its user-friendly interface allows traders to navigate through multiple markets with ease, making it accessible for beginners while offering enough depth for experienced analysts. The platform seamlessly integrates real-time data streams, customizable layouts, and interactive tools that transform raw data into actionable insights. Its cloud-based architecture ensures that users can access their work from any device, promoting flexibility and continuous market engagement.
Core Tools and Charting Capabilities
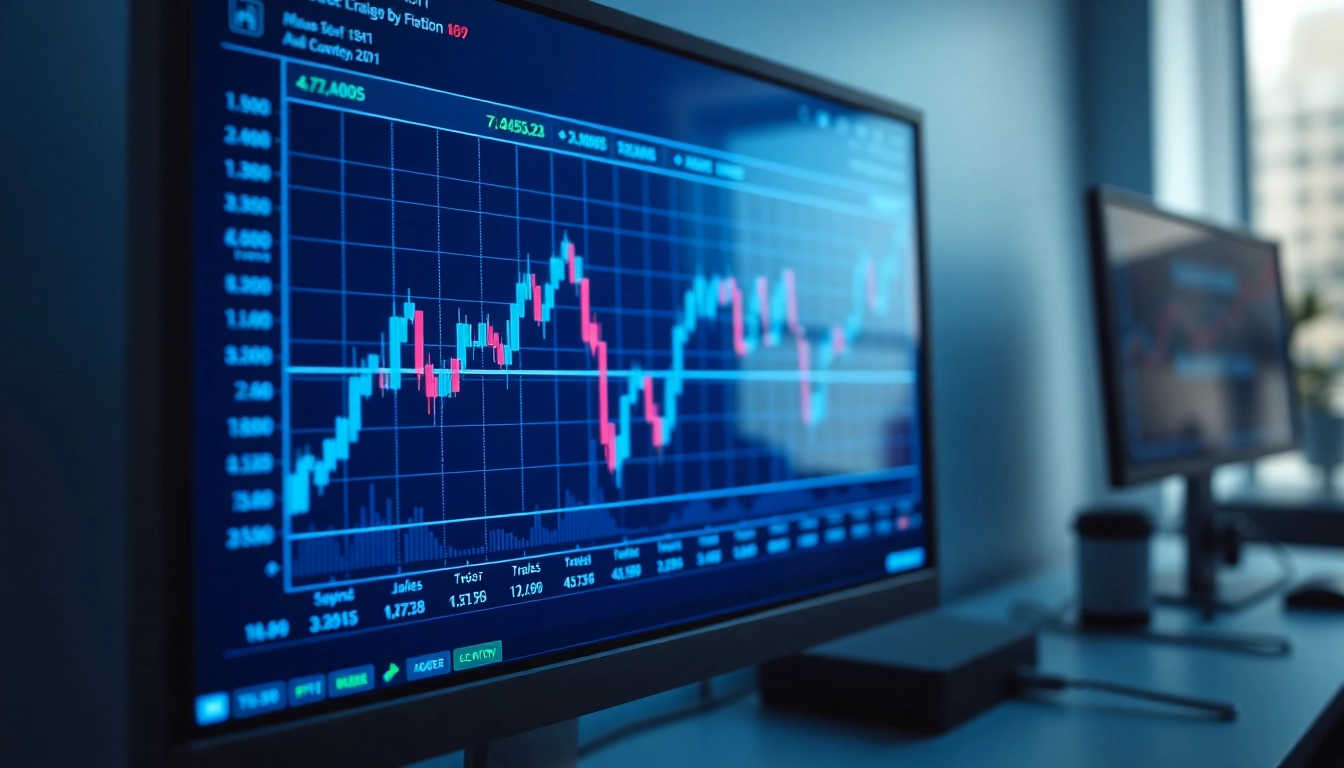
At the heart of Trading View are its advanced charting tools that support a wide spectrum of technical analysis. Users can select from dozens of chart types including candlestick, line, bar, and area charts, each customizable with color schemes, grid options, and timeframes. The platform provides over 50 built-in technical indicators—such as Moving Averages, Bollinger Bands, RSI, and MACD—and allows for the integration of custom scripts via Pine Script. This scripting language enables traders to develop bespoke indicators and strategies. Interactive drawing tools like trendlines, Fibonacci retracements, and pattern drawing tools facilitate visual pattern recognition, crucial for anticipating market movements and confirming trade setups.
Market Coverage and Asset Types Available
Trading View boasts extensive market coverage, accommodating virtually every type of asset class. Traders can access real-time data on stocks, indices, commodities, forex pairs, cryptocurrencies, and bonds. Its integrated screener tools enable quick filtering and identification of potential investment opportunities across global markets. For instance, users can monitor major indices like the S&P 500, trade popular cryptocurrencies such as Bitcoin, or analyze sector-specific stocks—all within a single platform. This comprehensive market access offers traders a holistic view of global economic conditions, facilitating diversified and informed trading strategies.
How to Use Trading View for Successful Trading
Setting Up Custom Watchlists and Alerts
Effective trading begins with organized observation. Trading View allows users to create customized watchlists tailored to their interest areas, whether specific stocks, currency pairs, or crypto assets. These watchlists can be grouped and saved, enabling quick access and continuous monitoring. Coupled with real-time alerts—set based on price movements, indicator signals, or pattern recognitions—traders receive instant notifications, helping them act swiftly on market opportunities or risk management needs. To set up an alert, simply right-click on a chart or indicator and choose your preferred conditions, such as crossing a moving average or reaching a target price.
Analyzing Charts with Technical Indicators
Technical analysis remains central to successful trading, and Trading View offers an extensive suite of indicators. Traders can apply multiple indicators simultaneously to spot divergences, trend confirmations, oscillations, and overbought/oversold conditions. For example, combining RSI with Moving Averages can help validate breakout signals. The platform’s scripting capabilities also enable the creation of custom indicators that cater to specific strategies. Practice with backtesting these indicators on historical data to refine your approach before deploying live trades.
Integrating Social Trading and Community Ideas
One of Trading View’s distinguishing features is its active social community. Users can publish ideas, share analyses, and comment on others’ strategies. Engaging with this ecosystem fosters collective learning and exposes traders to diverse perspectives. For actionable insights, explore the ‘Community Ideas’ section to identify trending strategies, or follow professional analysts for inspiration. Incorporating community insights into your analysis can serve as an additional confirmation signal when planning trades.
Advanced Techniques for Market Analysis
Using Multiple Time Frames for Better Insights
Multi-timeframe analysis involves examining price charts across various periods—such as daily, hourly, and minute charts—to understand broader trends and precise entry points. Start with higher timeframes to identify overall trends, then zoom into lower frames for pinpointing entry and exit levels. Trading View’s layout customization makes it easy to view multiple charts side-by-side, enhancing your analytical accuracy.
Employing Drawing Tools for Pattern Recognition
One of the platform’s strengths is its suite of drawing tools that facilitate pattern recognition. Recognize formations such as head and shoulders, pennants, or Elliott wave patterns using trendlines, Fibonacci retracements, and shape tools. Accurate pattern identification often leads to high-probability trades. Practice and learning are key—analyzing historical patterns can improve your ability to anticipate future movements.
Combining Trading View Data with Fundamental Analysis
While Trading View excels at technical analysis, integrating fundamental data enhances decision-making. For stocks, review earnings reports, economic indicators, or news feeds alongside chart analysis. For cryptocurrencies and forex, stay updated with macroeconomic releases. Some integrations or external data sources can be linked with Trading View, creating a comprehensive analysis environment that combines quantitative signals with qualitative insights.
Optimizing Your Trading View Experience
Customizing User Interface and Layout
Efficiency in trading often hinges on a personalized workspace. Trading View allows extensive customization—from arranging multiple chart windows to selecting color themes that reduce eye strain. Save different layouts for specific trading setups or asset classes, enabling rapid switching between strategies. The platform also supports keyboard shortcuts for swift navigation.
Leveraging Mobile and Desktop Apps Effectively
Trading View offers dedicated mobile apps for iOS and Android, as well as a desktop version for Windows and MacOS. Use the mobile app for quick updates and alerts when on the go, while the desktop client provides a more comprehensive environment for analysis and strategy development. Synchronize your account across devices to maintain continuity and always stay connected to market movements.
Managing Account Security and Preferences
Security is vital, especially when linked with trading accounts. Ensure two-factor authentication is enabled, and review privacy settings regularly. Customize your notification preferences to receive relevant alerts without noise. Regularly update your password and monitor account activity for suspicious login attempts. Proper security management protects your trading assets and personal information.
Case Studies: Successful Trading Strategies with Trading View
Forex Market Analysis and Entry Points
Traders frequently leverage Trading View for Forex by analyzing currency pairs through trendline confirmation, oscillators, and Fibonacci levels. For example, a trader observing a clear downtrend on a daily chart might wait for a bullish reversal pattern in a lower timeframe, confirmed by oversold RSI levels, before entering a long position. Setting alerts at key Fibonacci retracement levels ensures timely entries and exits in volatile markets.
Cryptocurrency Trading and Trend Prediction
Crypto traders utilize Trading View’s real-time data and social insights to identify breakouts or breakdowns in coins like Ethereum or Bitcoin. For instance, spotting a symmetrical triangle pattern combined with volume spikes might signal a substantial upcoming move. Engaging with community ideas can validate your analysis or offer alternative perspectives, improving the accuracy of your predictions.
Stock Market Investment Planning
Long-term investors can utilize Trading View for fundamental overlay and technical timing. Analyzing earnings trends alongside moving average crossovers can help determine the best entry points for bullish momentum. Conversely, recognizing overbought conditions with MACD divergence might signal a good time to take profits or wait for a correction.


